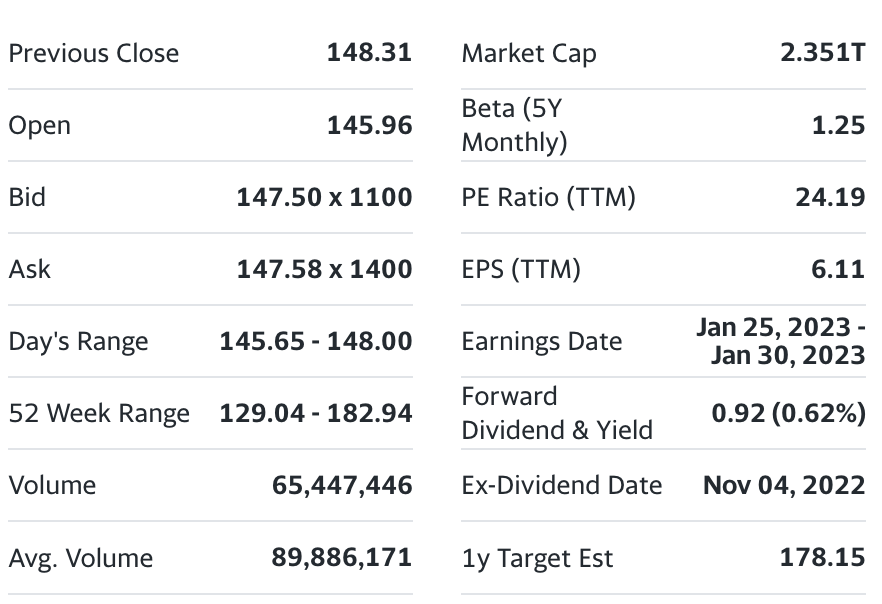
Understanding a Stock Summary Chart
Stock Summary Chart
-
What is Market Cap
One way to gauge a company's size is through market capitalization, also known as market cap. It represents the overall market value of a firm's outstanding shares of stock, which includes both publicly traded and restricted stock held by executives and insiders of the company. In other words, it's the value of the business. You can calculate this value by multiplying the amount of total shares by the total number of shares.
-
What is the PE Ratio
P/E ratio, or price-to-earnings ratio, is a quick way to see if a stock is undervalued or overvalued. Generally speaking, the lower the P/E ratio is, the better it is for both the business and potential investors. The metric is the stock price of a company divided by its earnings per share.
-
What is Volume and Average Volume
The volume of a particular stock, index, or other investment is simply the total number of shares traded over a specific time period. The average volume of a certain stock, index, or other investment is the average number of shares traded in a single day.
-
What Does EPS Stand For
Earnings Per Share
-
What is a Dividend
Dividends are quarterly payments that a corporation makes to its investors as a way of sharing its profits. The price per share and the frequency of dividend payments are set by the board of directors of a firm. Investing in dividend stocks can offer a steady income stream, which is particularly useful when there is inflation.
-
What is an Earnings Report
A quarterly earnings report is a filing made by public companies every three months to report on their most recent financial performance
Video on Analyzing the Stock Market Summary Chart
Watch the video below on what to look for and how to analyze the stock market summary chart. In this video, ClearValueTax explains the terminology listed in the chart.
